The Xymon configuration is kept in the files in the ~/server/etc/ directory. If you look at this directory, you will see these files:
The hosts.cfg file defines which hosts Xymon monitors. When you install Xymon,
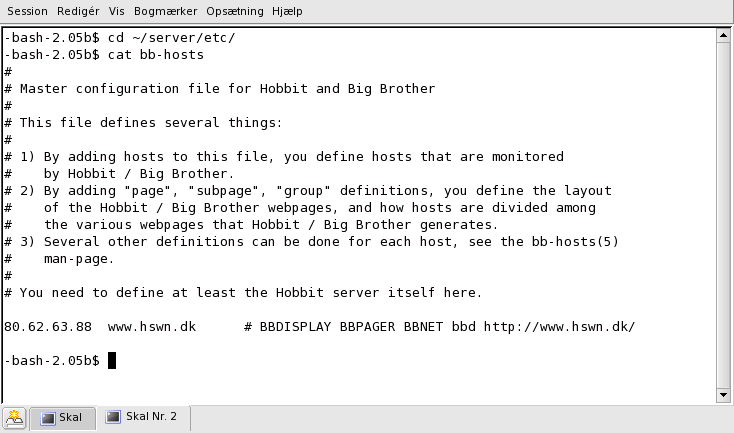
a simple configuration is setup that just lists the Xymon server:
There are a few things to notice here:
The hosts.cfg file shown in the example has only one host defined: www.hswn.dk which is the server running Xymon. There are a few extra keywords thrown in:
By default, Xymon will always check if the host is up and running by trying to "ping" it. This results in a conn column on the Xymon webpage for this host, showing if the ping-test succeeded. If you have a host that does not respond to ping - e.g. because there is a firewall that filters out such requests - then you can disable the ping-test by putting a "noconn" keyword on the line in hosts.cfg.
As you can see, the syntax is pretty straight-forward. Need to monitor an extra URL for this server ? Just add the URL to the line. Need to check if ssh (Secure Shell) is running ? Just add ssh to the line. The full set of keywords you can use is described in the hosts.cfg man-page. Many of the keywords relate to the way Xymon displays the information about the host on the web-pages, other keywords deal with how the uptime percentage is calculated for availability reports, and some keywords - like the bbd and http://... mentioned above - describe the network services that are tested for this host.
As shown in the example above, adding a network test for a host is as simple as putting the right keyword into the hosts.cfg file. The default set of network tests configured in Xymon 4.0 is as follows:
| conn | Simple ping test. Enabled by default, you can disable it by putting "noconn" into hosts.cfg. |
|---|---|
| http | Web-server test. Enter the URL to request from the webserver. |
| ftp | FTP server test. |
| ssh | SSH (Secure Shell) server test. Supports ssh1 and ssh2. |
| telnet | Telnet server test. |
| smtp | SMTP (Mail server) test. |
| pop3 | POP-3 test. |
| imap | IMAP test. IMAP version 2 and 4 are supported, for version 3 use "imap3". |
| nntp | NNTP (News) server test. |
| ldap | LDAP (Directory server) test. Enter the full LDAP URI if Xymon is configured with LDAP support. |
| rsync | rsync server test |
| bbd | Xymon network daemon test (historically named after the Big Brother daemon, bbd). |
| clamd | CLAM anti-virus daemon test. |
| spamd | SpamAssassin anti-spam daemon test. |
| oratns | Oracle TNS listener test. Will attempt to do an oratns "ping". |
| qmtp | QMTP server test. For qmail's qmtpd service. |
| qmqp | QMQP server test. For qmail's qmqpd service. |
If Xymon is built with OpenSSL support, the following SSL-enabled services can also be checked:
| https | Web-server test. Enter the URL to request from the webserver. |
|---|---|
| ftps | Secure FTP server test. |
| telnets | Secure Telnet server test. |
| smtps | Secure SMTP server test. |
| pop3s | Secure POP-3 server test. |
| imaps | Secure IMAP server test. |
| nntps | Secure NNTP (News) server test. |
| ldaps | Secure LDAP (Directory) server test. Enter the full LDAP URI if Xymon is configured with LDAP support. Note that this is only possible when Xymon is built with the OpenLDAP v2.x client library, and only for LDAP servers that support LDAP version 3 and the "starttls" command. LDAP server that use the older non-standard method of tunnelling LDAP through SSL on port 636 will not work. |
There are a few network tests that Xymon can run for you, by using external programs. This is not a very effective way of testing, so it is only done this way for a few very specialised tests:
| ntp | NTP (Network Time protocol) server test, using the "ntpdate" command. |
|---|---|
| rpc | RPC service test. This queries the portmapper service on the server, using the "rpcinfo" command. See the hosts.cfg(5) man-page for details on how to test for specific RPC services. |
You can install a client on each of the hosts you monitor, to check host-specific data such as CPU utilisation, disk usage, if certain processes and services are running etc. Xymon includes clients for most Unix-like operating systems. A client for Windows is planned but the programming has not yet started.
First, make sure you have installed the Xymon client on all of the hosts you want to monitor, and you have these hosts listed in your hosts.cfg file. The Xymon client will pick up the hostname of the box it is running on automatically, but it is not uncommon for the name it finds to be different from what you've put into hosts.cfg. So if you know that the client is running but no data appears, check that the hostname used by the Xymon client is the one you expect. See this FAQ item for details.
With the Xymon client running and reporting data into Xymon, you should see the cpu-, disk-, memory- and procs-columns appear. The color of these status columns is determined by settings in the analysis.cfg configuration file. Here is an example of how to setup a host:
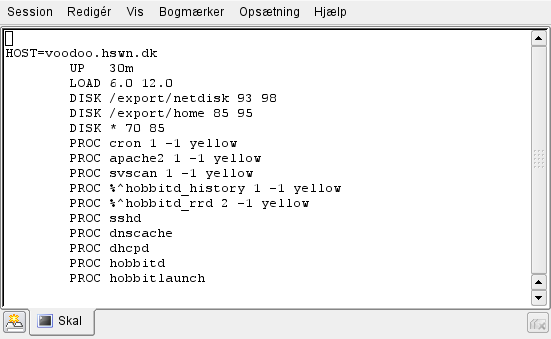
As you can see, there's first a definition of what hosts the following criteria applies to. Here, it is only a single host: voodoo.hswn.dk - but you can use various filters on hostnames, pagenames and time of day to determine what the thresholds should be for each of the criteria monitored with the client data. The analysis.cfg man-page describes this in detail.
After the host filter comes the criteria used to determine the color of each of the status columns.
| UP | Sets the cpu column color, based on how long the host has been up. After the UP keyword you put two time limits: The first one (30m in the example) defines how long after a reboot the cpu column is yellow. The second (optional) value causes the cpu column to go yellow after the host has been up for this long - it may be useful, if you need to reboot your servers regularly. |
|---|---|
| LOAD | Sets the cpu column color, based on how much load is
on the system.
After the LOAD keyword you put two limits: The first number
is the limit where the cpu column goes yellow; the second
is the limit where the cpu column goes red. For Unix systems, this threshold is matched against the 5-minute load average value, as reported by the "uptime" command - it is therefore a positive number. For Windows systems, this threshold is matched against the CPU utilisation - this is a percentage between 0 and 100. |
| DISK | Sets the disk column color based on how full the filesystem
is. This takes three parameters: The name of the filesystems;
the threshold where it goes yellow; and the thresholds where it
goes red. The name of the filesystem is the mount point. You can specify this either with the full path, or you can use * meaning "all filesystems". You can also use regular expressions by prefixing the expression with a percent sign, e.g. "%^/ora.*" would match all filesystems that are mounted on a path beginning with "/ora" - "/ora/db/vol1" for instance. As shown in the example, you can have multiple specifications with different thresholds - these are evaluated from top to bottom, so it is best to put the most specific ones first, and the general ones last. The yellow and red thresholds are percentages - they trigger when the filesystem has filled up to the percentage you specify. |
| PROC | Sets the procs column color based on what processes are running.
This takes at least one parameter: A string that is (part of) the
command line that the process runs. You can have a simple string here
or a regular expression - Xymon will scan the "ps" output
for the string or expression, and count how many times it appeared
in the ps listing. The process count is then matched against the thresholds that are the second and third parameter - the second parameter is the minimum count (by default: 1), and the third parameter is the maximum count (default: -1, meaning unlimited). Note: If you want to set a maximum count, then you must also set a minimum count - even if it is 1. The last parameter defines the color used for the procs column, if the process count does not fall within the thresholds. By default it will go red - you can put "yellow" as the last parameter. You can have several PROC entries for the same host, if you need to monitor multiple processes. |
| MEMPHYS MEMACT MEMSWAP |
Set the memory column color based on the thresholds for memory
utilisation. Each of these keywords takes two parameters: The first
is the warning (yellow) threshold - in percent - of memory used.
The second is the panic (red) threshold - in percent - of memory
used. By using one of the three keywords, you can set thresholds for the physical memory (RAM), the swap space, and - on platforms supporting this, e.g. Linux - the actual amount of memory used for applications. |
| LOG | Set the msgs column color. This takes at least two parameters:
The first is the name of the logfile, the second is a pattern
defining which logentries trigger a change of color. Optionally, this can be followed by a third parameter defining which color this LOG entry causes, and fourth parameter which is an "ignore" pattern you can use to filter out lines which do match the first pattern of lines that trigger a change in color, but that you really do not want to trigger a color change. |
Configuring the LOG entries in the analysis.cfg file is only one half of the configuration - you also need to tell the Xymon client running on the monitored system that it must send in some data from that logfile in the first place. For that, you must configure the client-local.cfg file with the name of the logfile.